ST 4U 80: VA Smalltalk Debugger Overview
Today's Smalltalk 4 You takes an overview look at the debugger in VA Smalltalk. If you prefer a written walkthrough to video, then skip down to it. If you have trouble viewing it here in the browser, you can also navigate directly to YouTube. To watch now, click on the image below:
If you have trouble viewing that directly, you can click here to download the video directly. If you need the video in a Windows Media format, then download that here.
You can also watch it on YouTube:
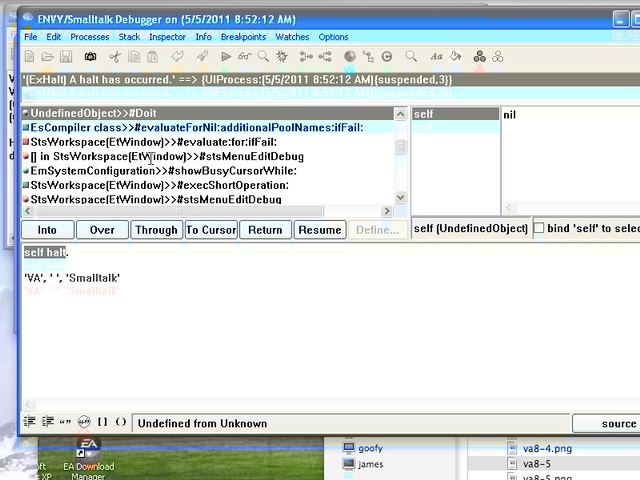
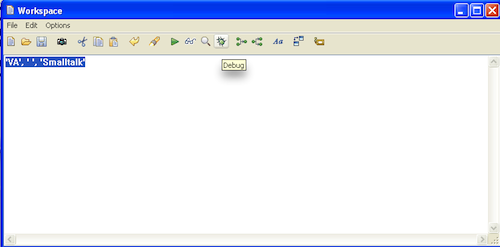
Today we'll take an overview look at the debugger in VA Smalltalk. It's a tool with a lot of functionality, so expect more on this topic soon. For today, we'll take a simple Smalltalk expression in the debugger and explore it via the debugger. Unlike the inspector, you'll need to highlight the expression in order to jump into the debugger:
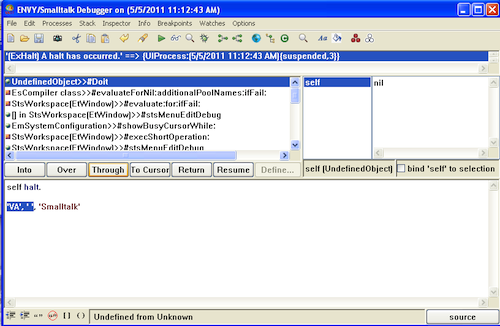
To execute the currently highlighted expression, use the Through button. That'll execute the expression, keeping the view in the current method. Over would skip past the expression, staying in this view:
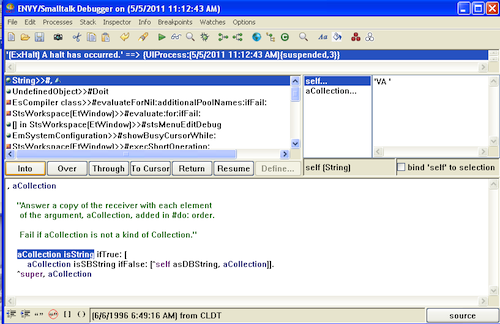
What if you want to jump into a highlighted method? Use the Into button - you'll jump into that code, and be able to step through the execution at that level. Note the change in the debugger view:
There are a lot of other things you can do from here - on the menu, note the Break option:
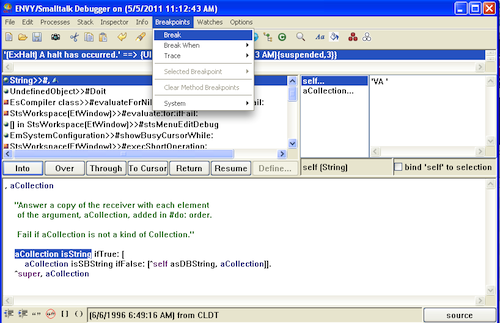
We'll get to the more advanced functionality in other tutorials. For now, you should know enough to start exploring the system, and see how various things work. Try it yourself!
Need more help? There's a screencast for other topics like this which you may want to watch. Questions? Try the "Chat with James" Google gadget over in the sidebar.
Technorati Tags: smalltalk, va smalltalk, debugger, tutorial
Enclosures:
[st4u80-iPhone.m4v ( Size: 6678011 )]
